Chart color switcher — Report chart color palette switcher in Stealth AI
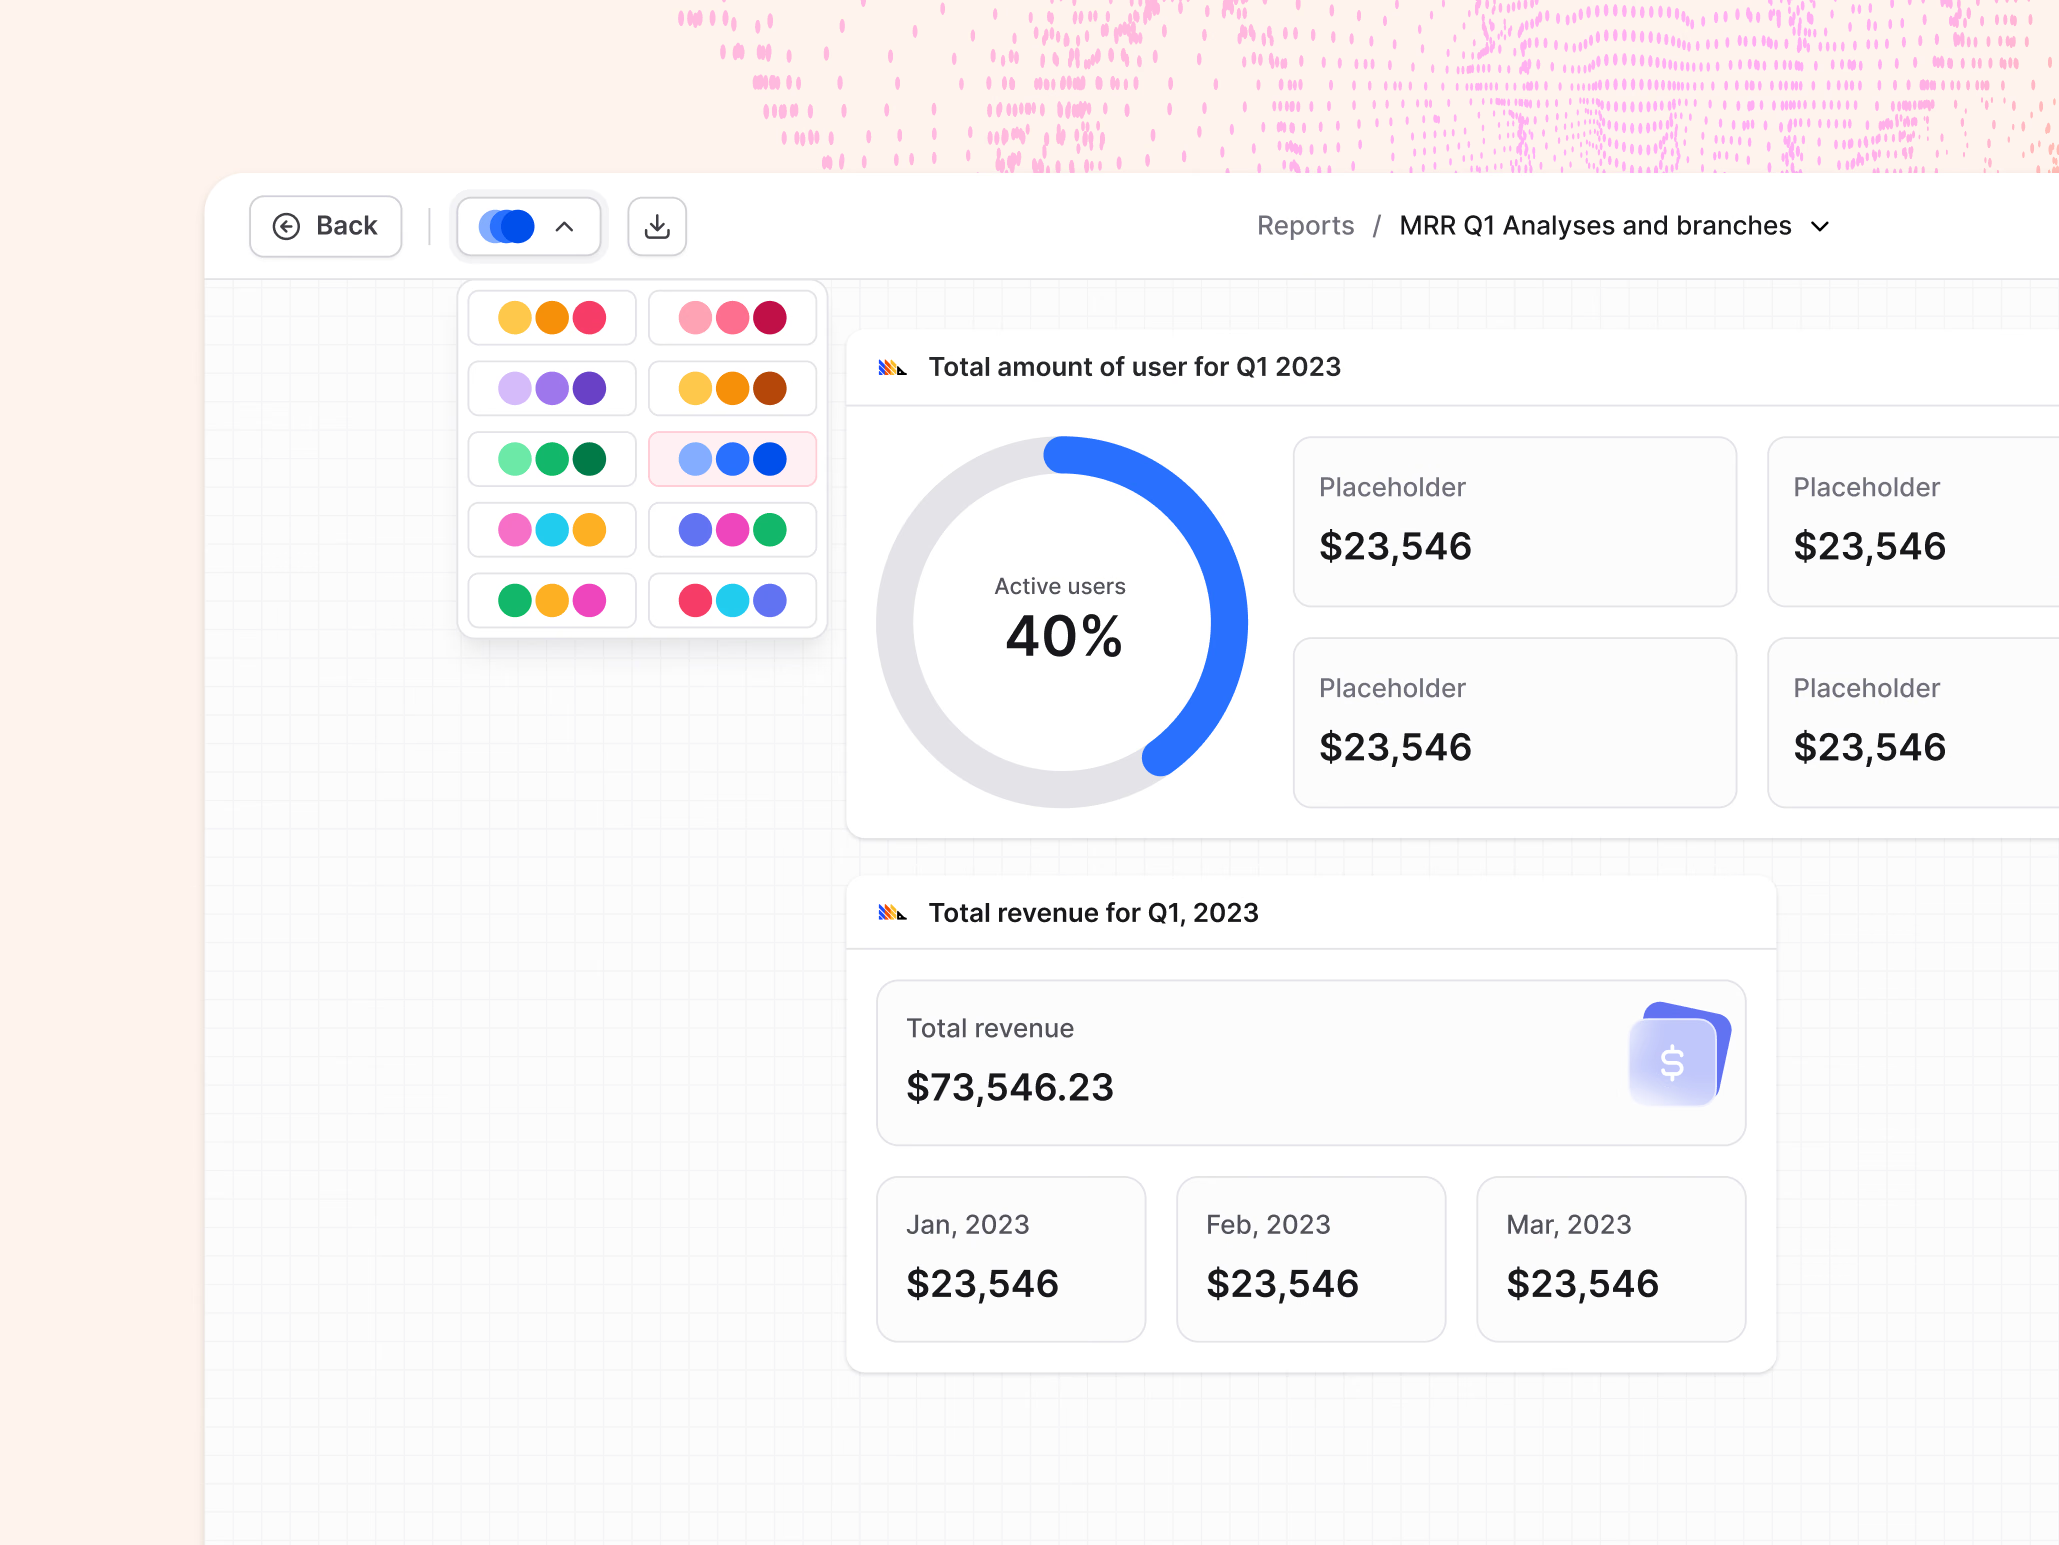
A color switcher for reports in Stealth AI.
A swatch button in the report’s toolbar opens a grid of three-color palettes, from warm oranges and pinks to blues, greens and purples. Picking one recolors the report: here the blue palette is selected, and the active users donut follows it. The report behind shows how widgets are laid out, a donut with stat tiles for users and a total revenue card with a tile for each month, under a breadcrumb back to the reports list.
Got something real to build?
I join your team as a design partner and stay for the long run, from the first flow to shipped UI.