Dashboard exploration — Writing stats dashboard exploration for a writing app
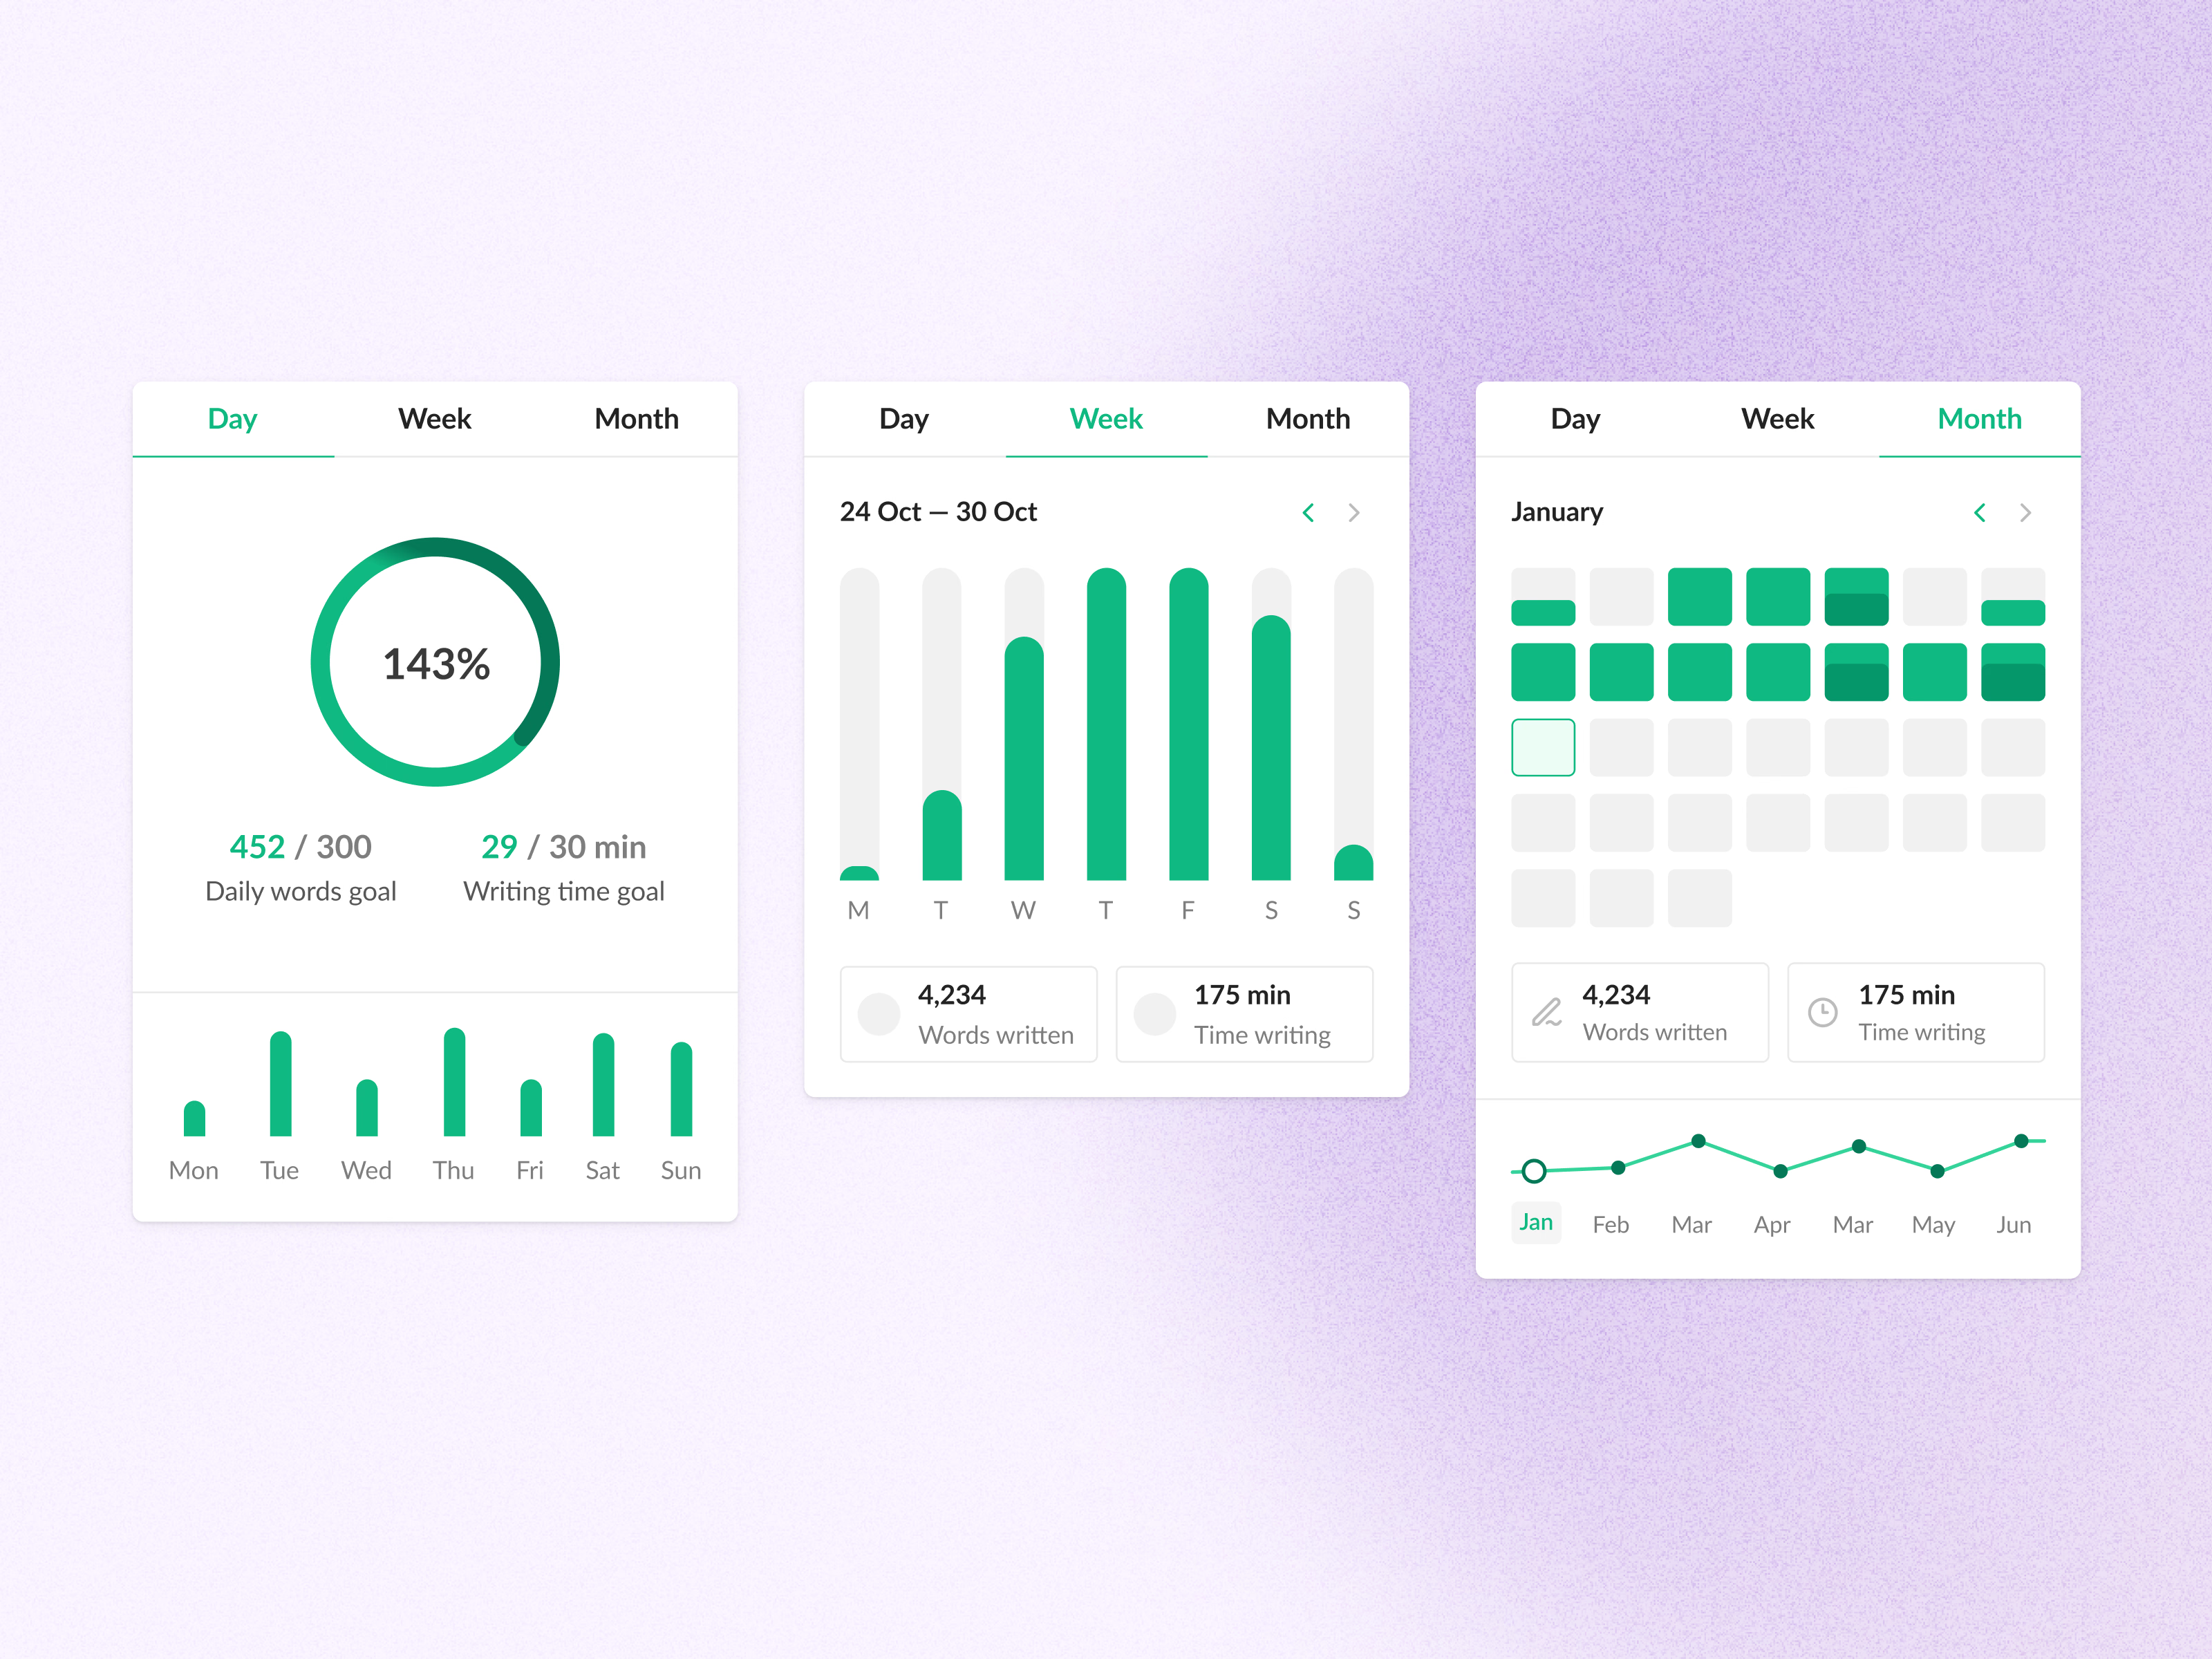
An exploration of writing stats in three views (day, week and month) for a writing app.
The day view leads with a ring for the daily words goal, which can run past 100% (143% in the example data), next to a writing time goal and a small bar chart of the week. The week view gives each day a bar against its goal, with words written and time writing totaled below. The month view turns into a calendar grid shaded by how much was written each day, with a line for the trend across months.
All three share the tabs and the green scale.
Got something real to build?
I join your team as a design partner and stay for the long run, from the first flow to shipped UI.