Finance forecast — Salary cost forecast view for Horus
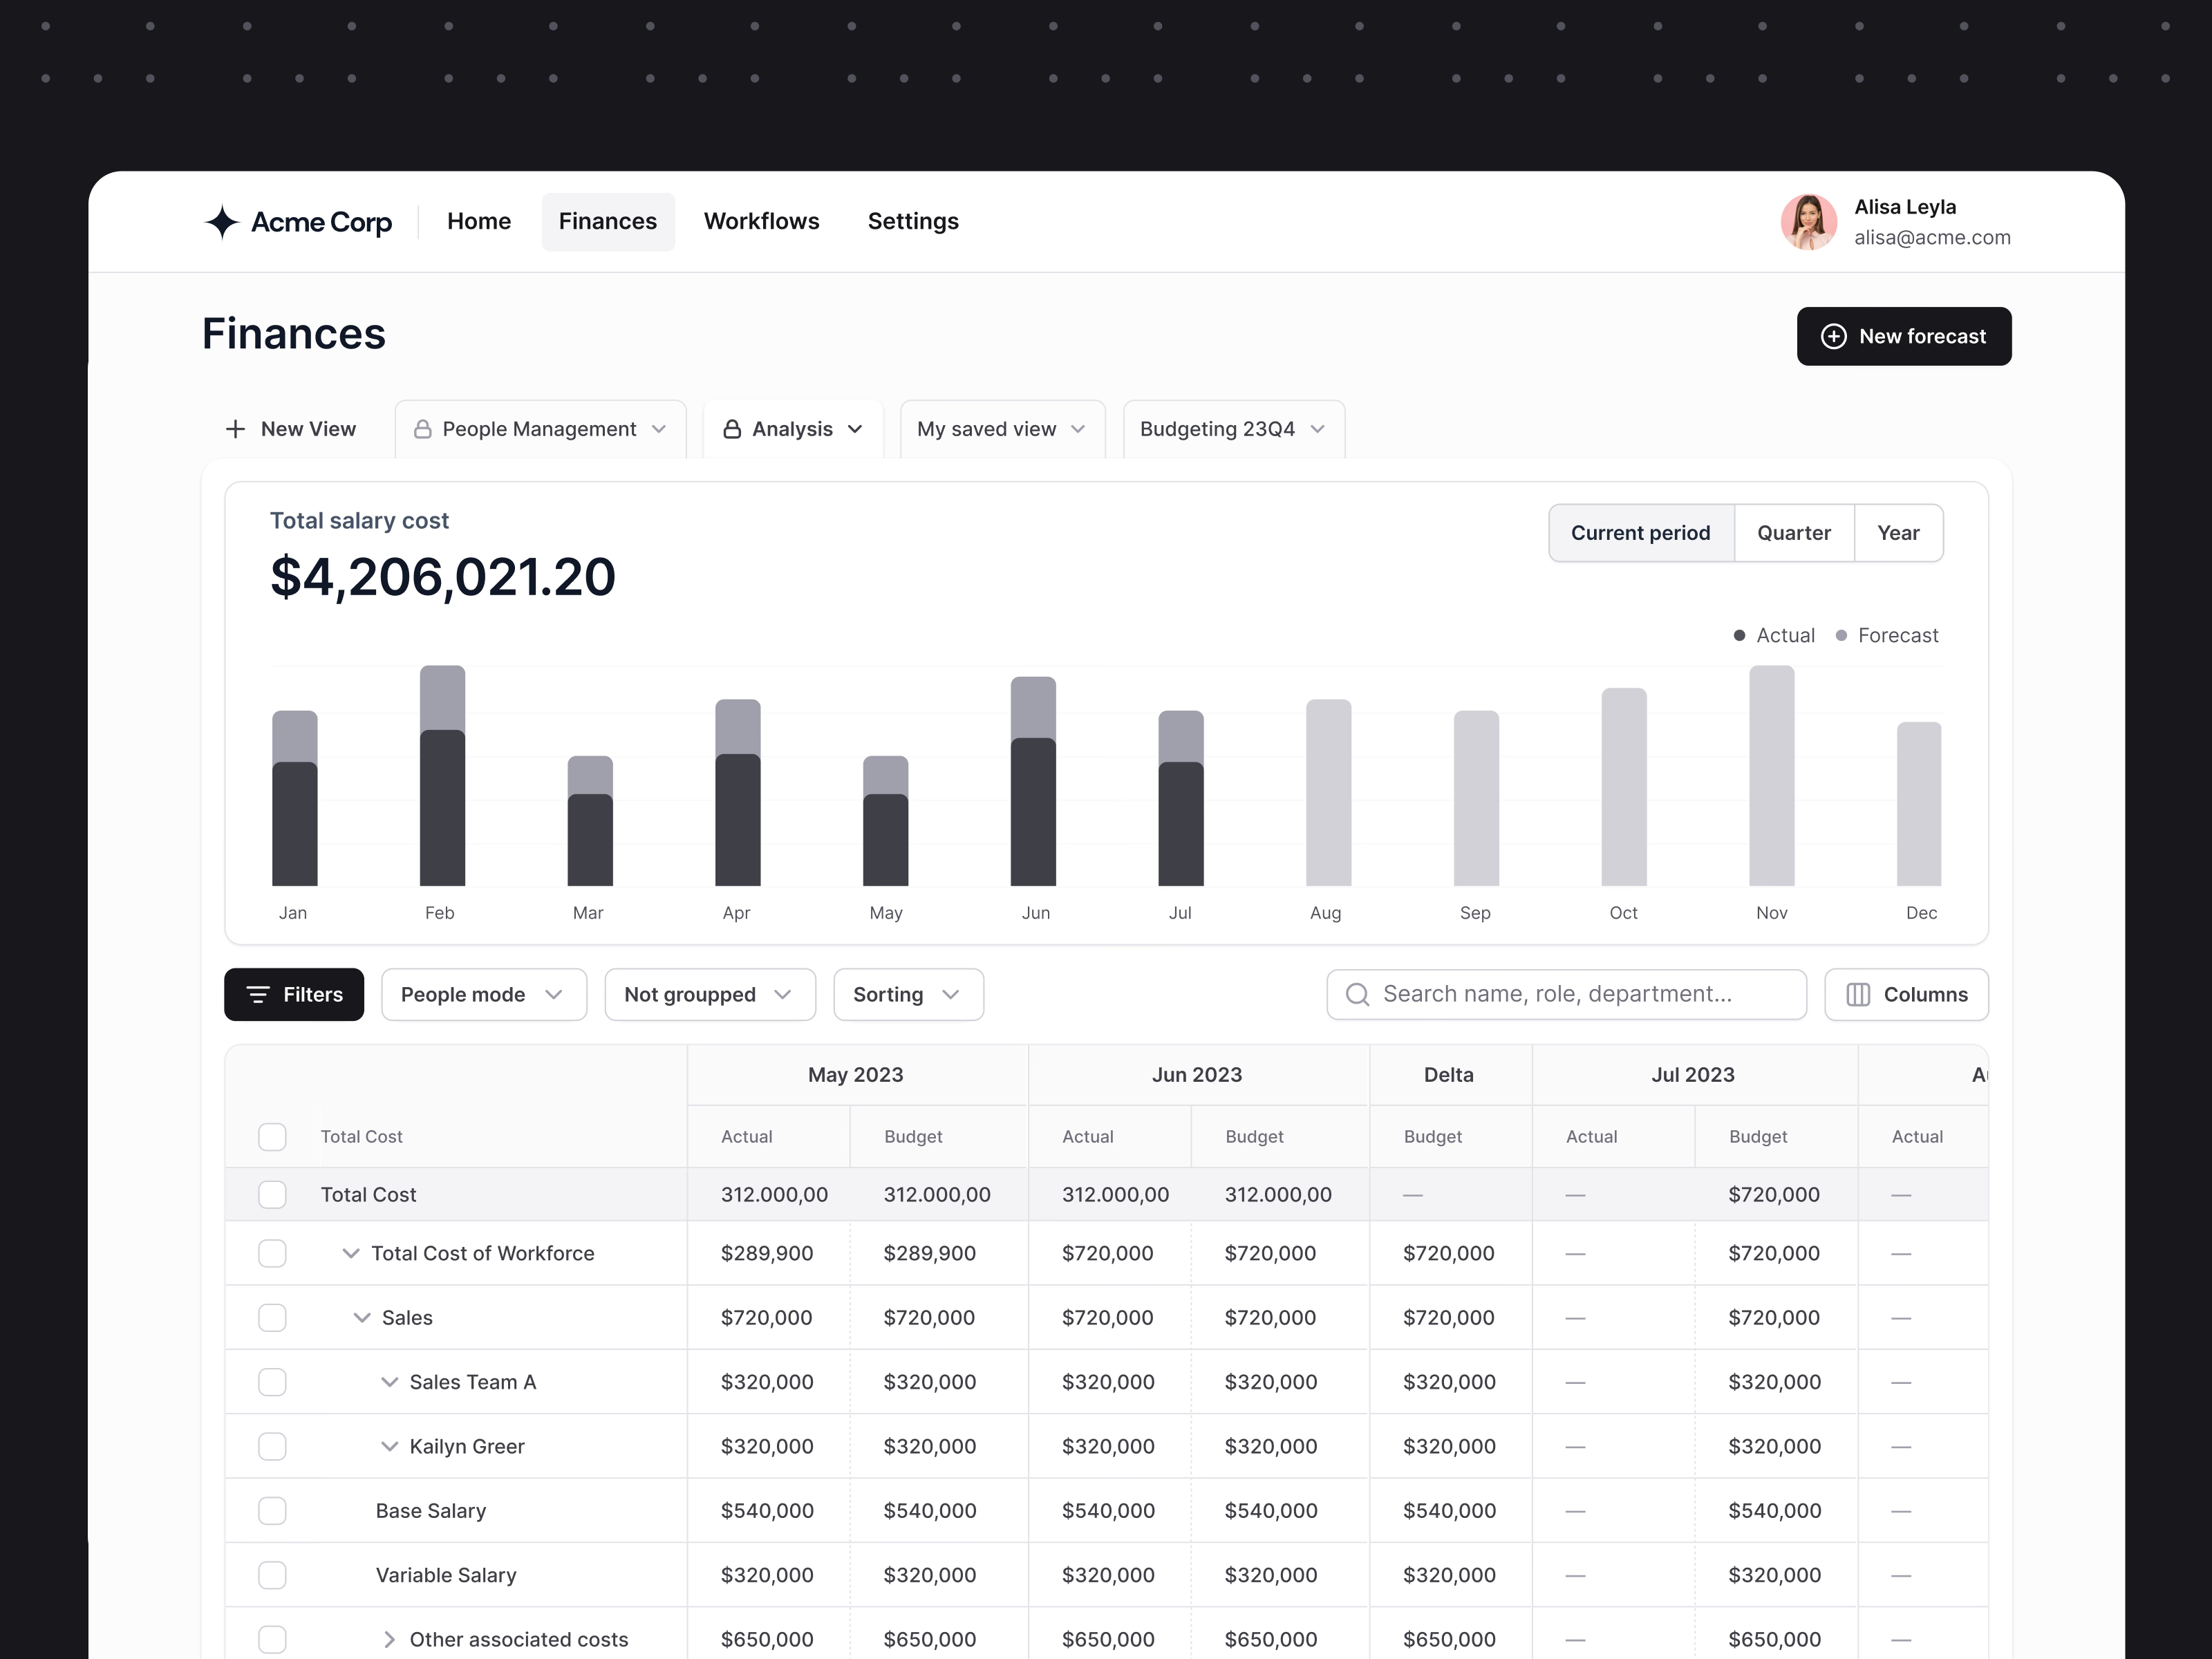
The forecast view in the Finances section of Horus, where actual salary cost meets the forecast.
A bar chart shows total salary cost by month, actual in dark bars and forecast in light ones, with a switch between current period, quarter and year. The table below breaks the same cost down as a tree, from total workforce cost to department, team and person, and down to base salary, variable salary and other costs. Each month has actual and budget columns, and a New forecast button sits at the top right.
Got something real to build?
I join your team as a design partner and stay for the long run, from the first flow to shipped UI.