Kaanjo Campaign Details — Campaign analytics dashboard for Kaanjo
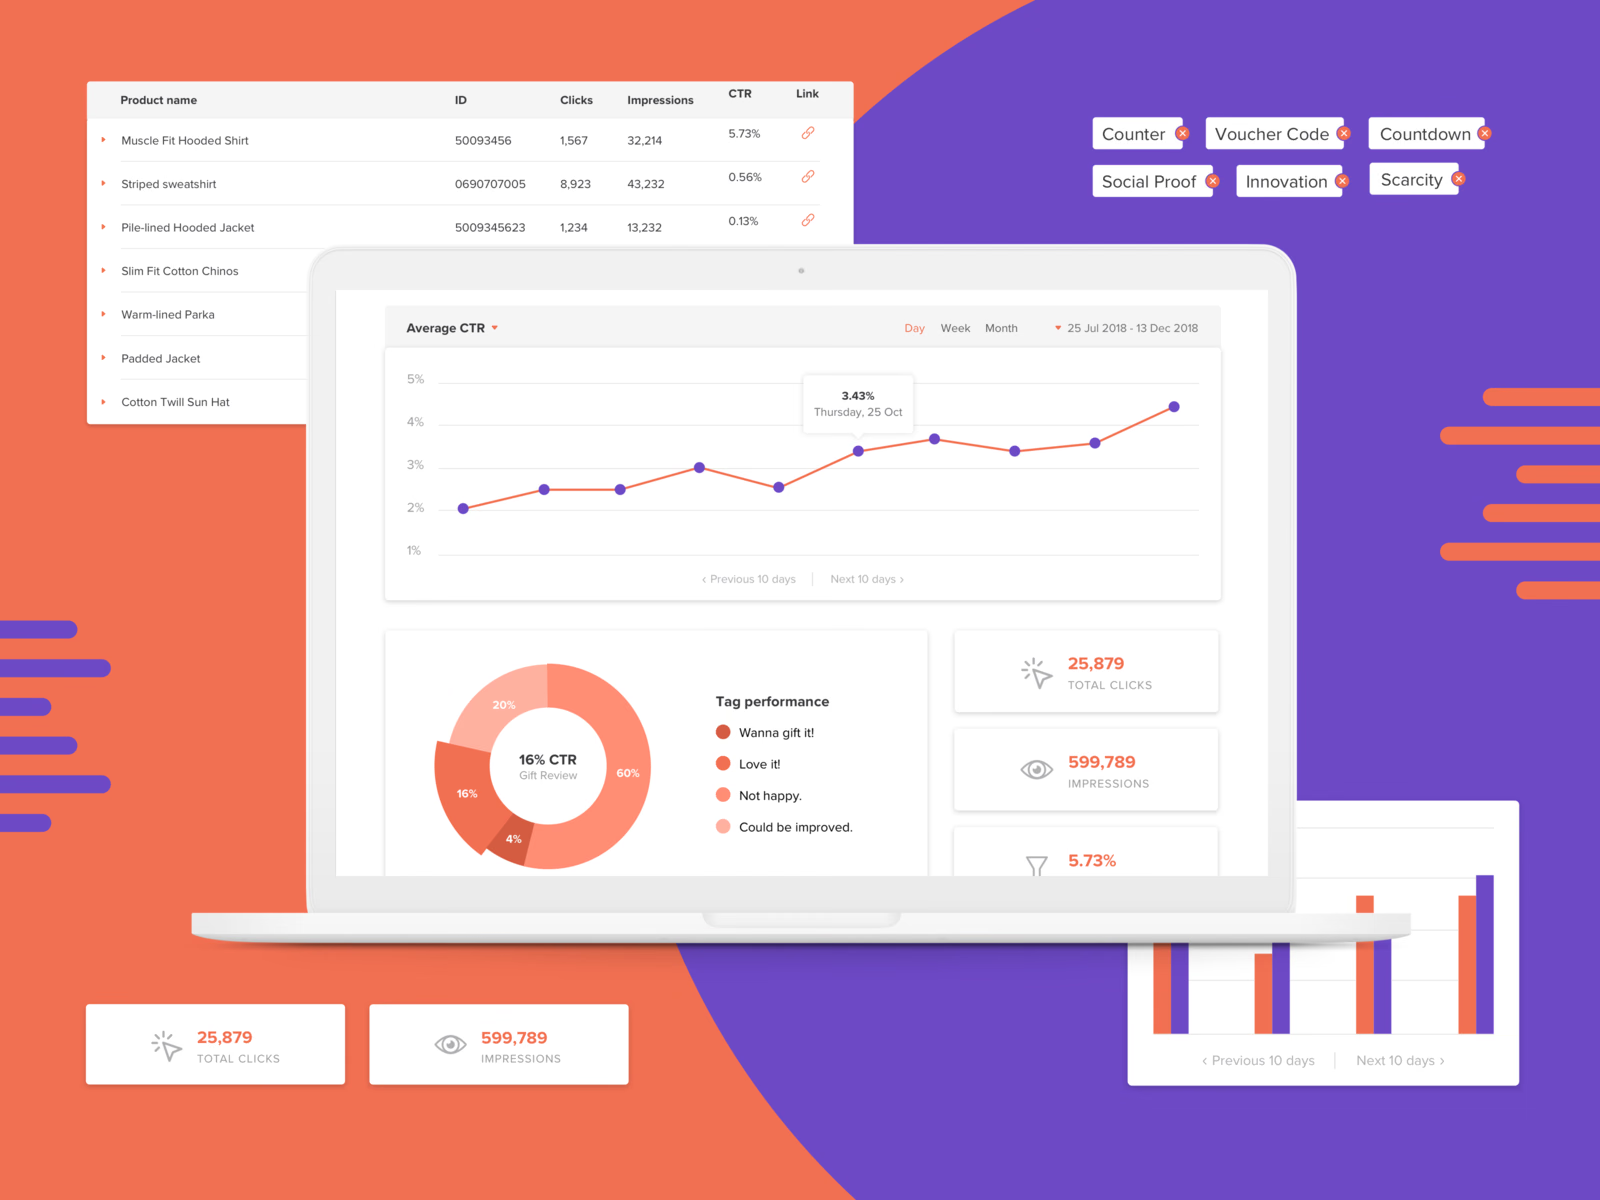
Campaign details in the Kaanjo dashboard.
A line chart tracks average CTR over a chosen period, by day, week or month, ten days at a time, with a tooltip on each point. Tag performance splits results across labels like Love it! and Not happy. Totals for clicks, impressions and CTR sit in cards beside it.
Around the laptop: the product table with clicks, impressions, CTR and a link for each item, a set of removable campaign tags such as Countdown, Social Proof and Scarcity, and a paired bar chart.
Got something real to build?
I join your team as a design partner and stay for the long run, from the first flow to shipped UI.