Report creation — AI report canvas with widgets in Stealth AI
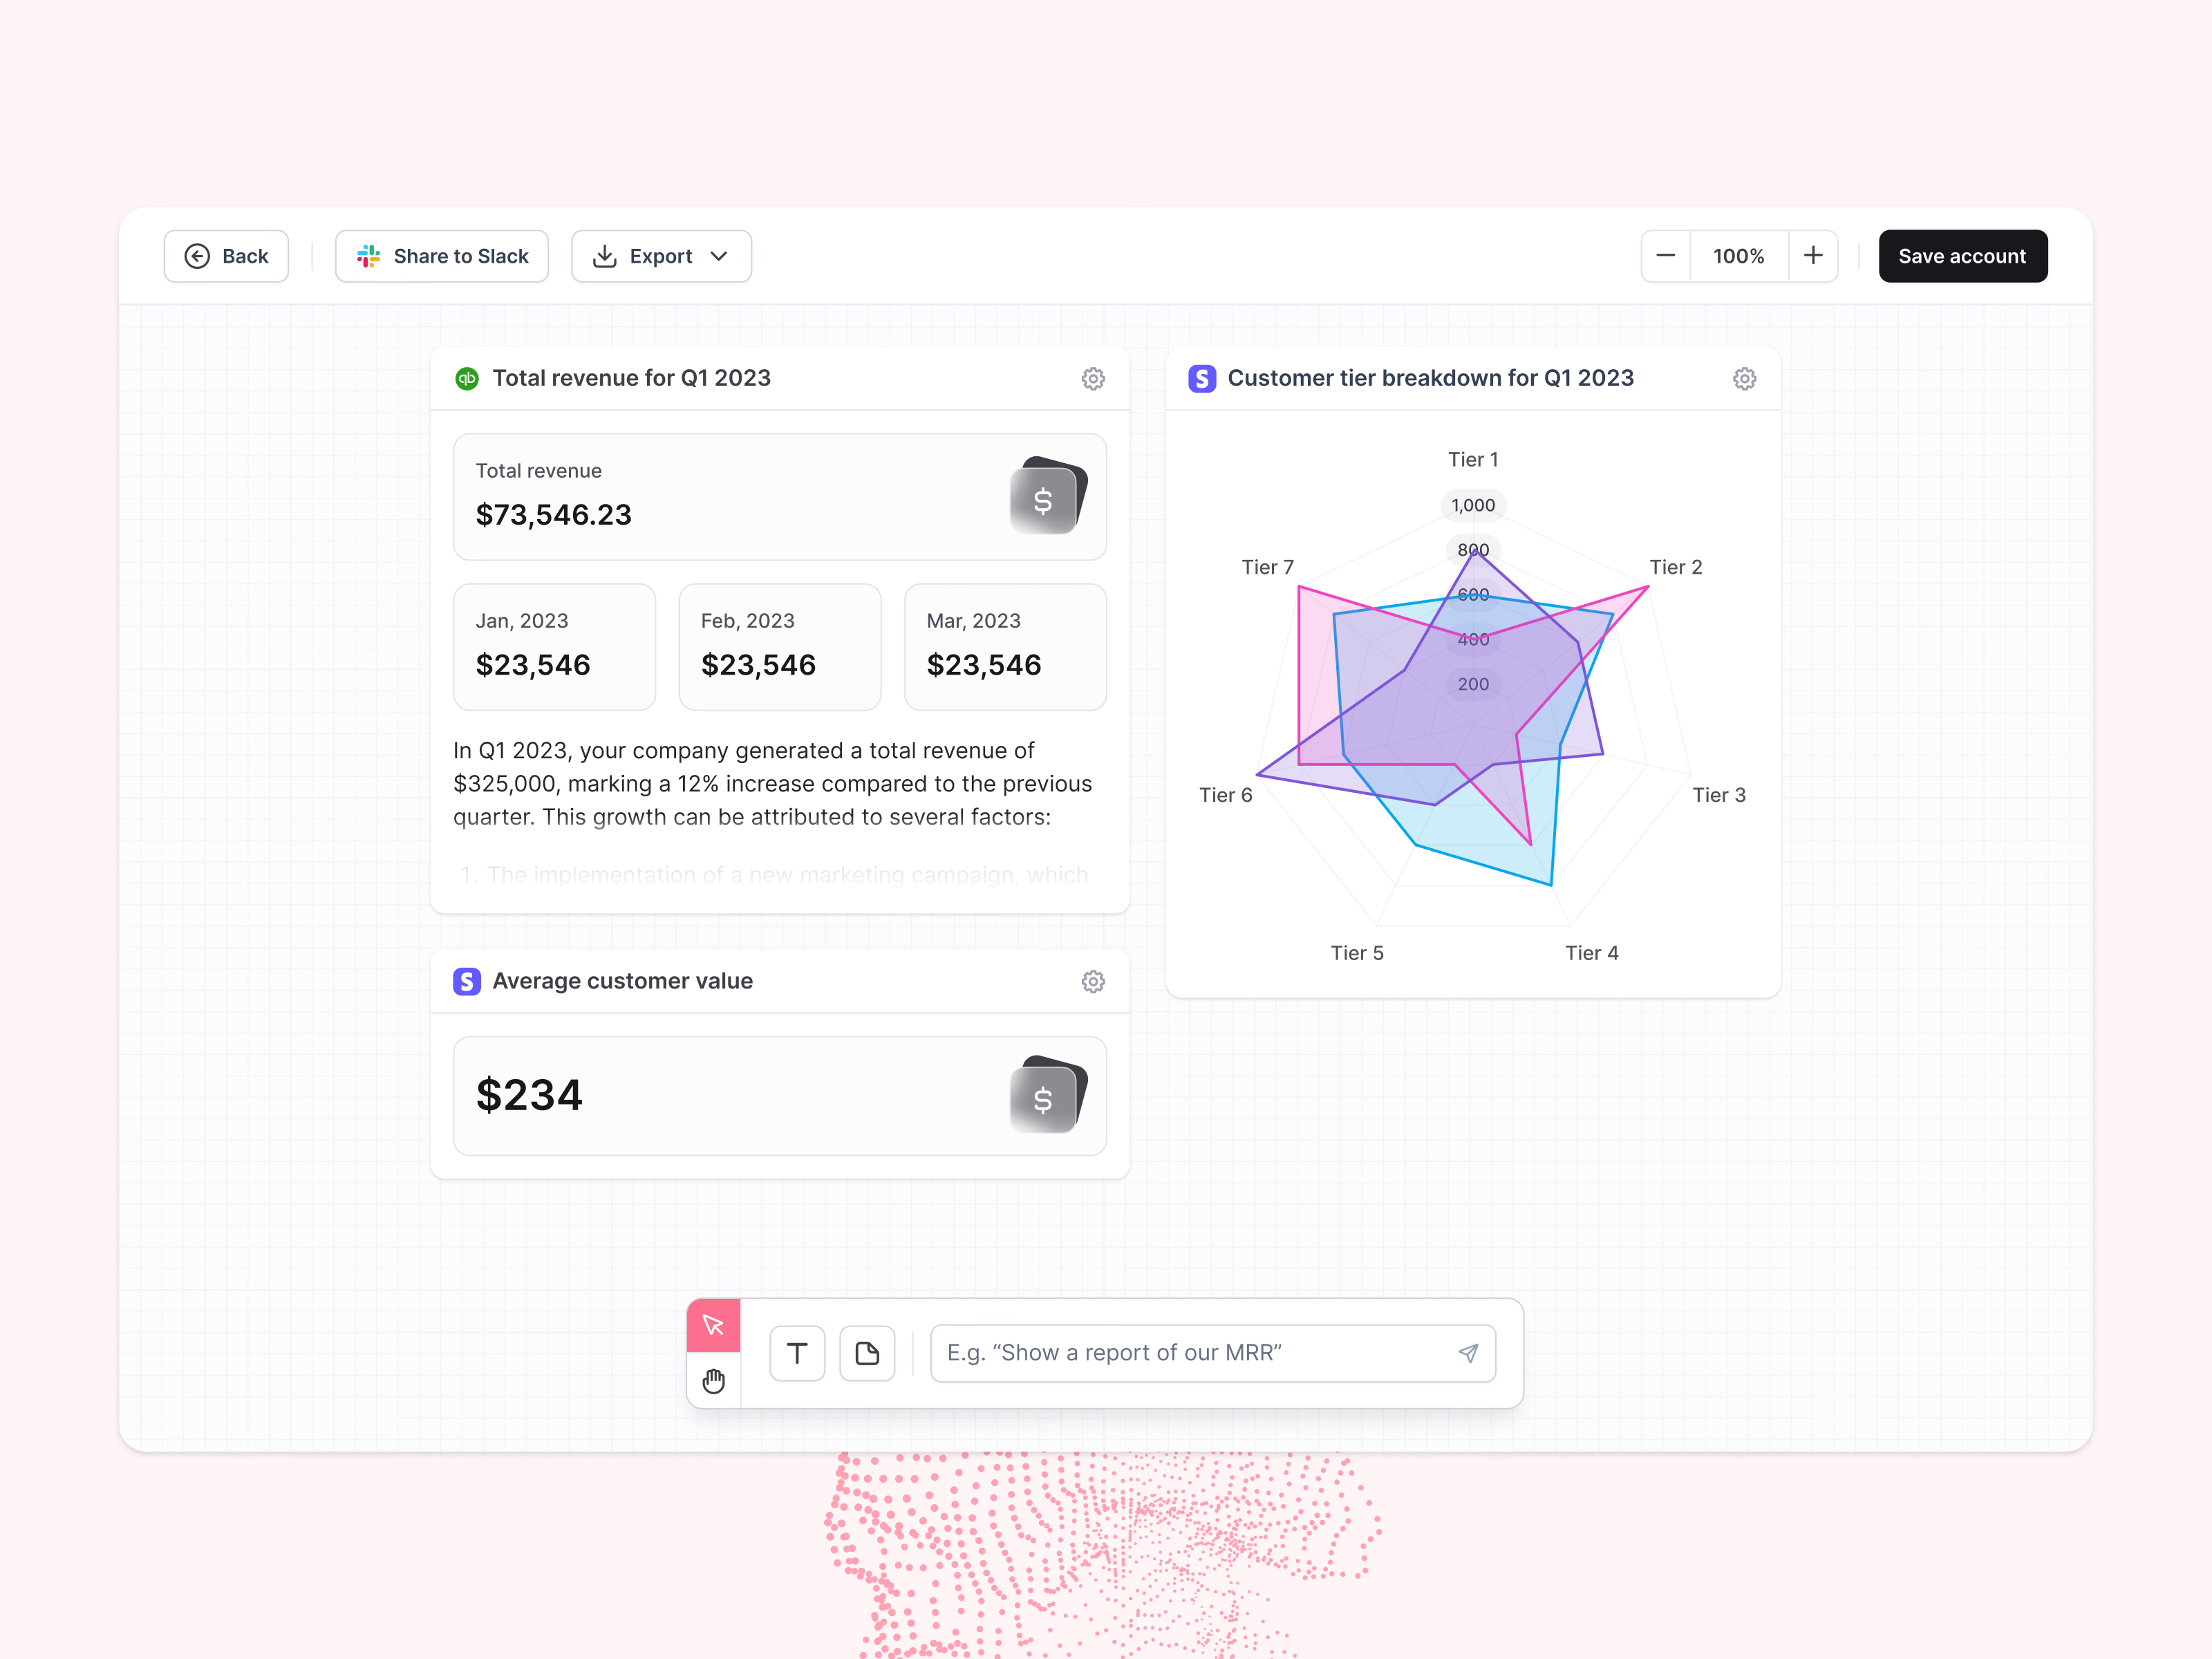
Building a report on a canvas in Stealth AI.
Widgets sit on a grid like a whiteboard: total revenue for the quarter with a written explanation, a radar chart breaking customers down by tier, and a single number for average customer value. Each carries the icon of its data source and a settings button. A floating toolbar at the bottom holds the canvas tools and a prompt for asking for the next chart, while the header handles sharing to Slack, export and zoom.
Got something real to build?
I join your team as a design partner and stay for the long run, from the first flow to shipped UI.