Responsive Graph — Responsive campaign chart for Instaon on mobile
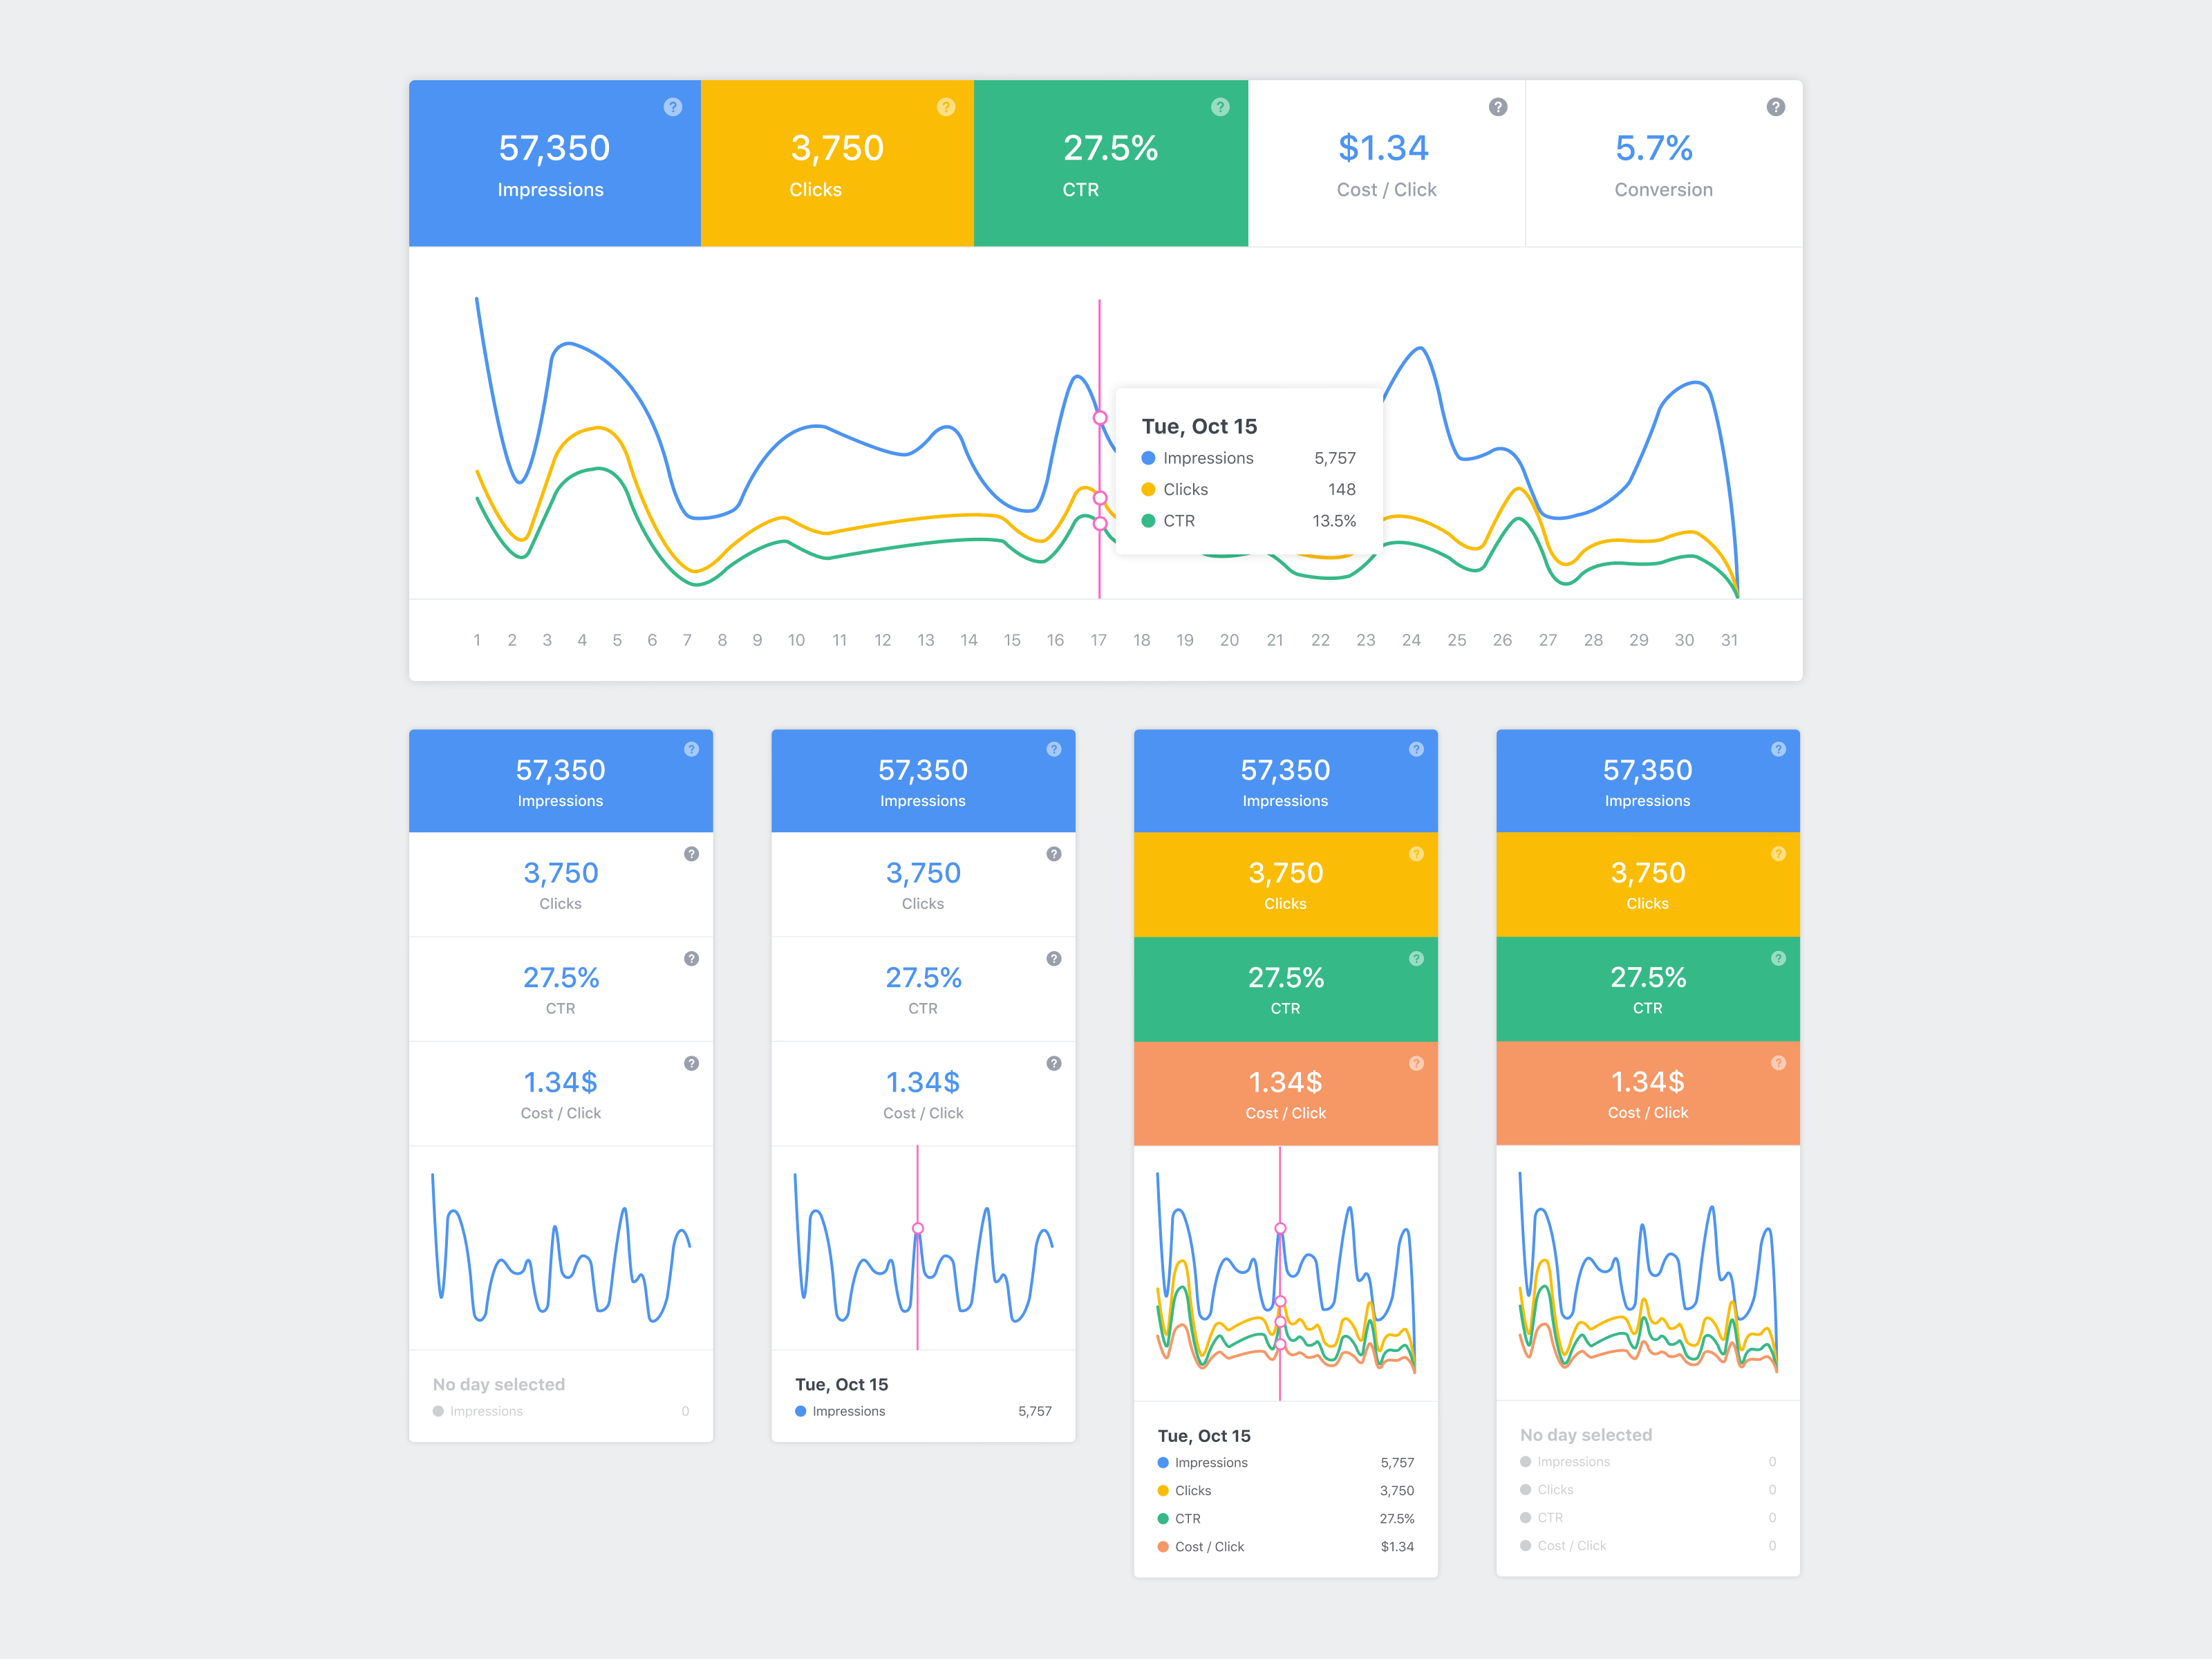
A responsive campaign chart for Instaon, showing several layers of data on desktop and on a phone. This is where Instaon’s campaign chart landed after a few iterations, with the mobile states shown under the desktop version.
On mobile the metric tiles stack above the chart, and each selected one adds its line. Details you don’t need on a small screen are gone, such as the row of dates. The summary under the chart lists a selected day’s values and otherwise shows an empty no day selected state. One metric is always selected by default, so the chart never starts blank.
Got something real to build?
I join your team as a design partner and stay for the long run, from the first flow to shipped UI.