Data Mind - Analytics — Resource analytics dashboard in Datamind
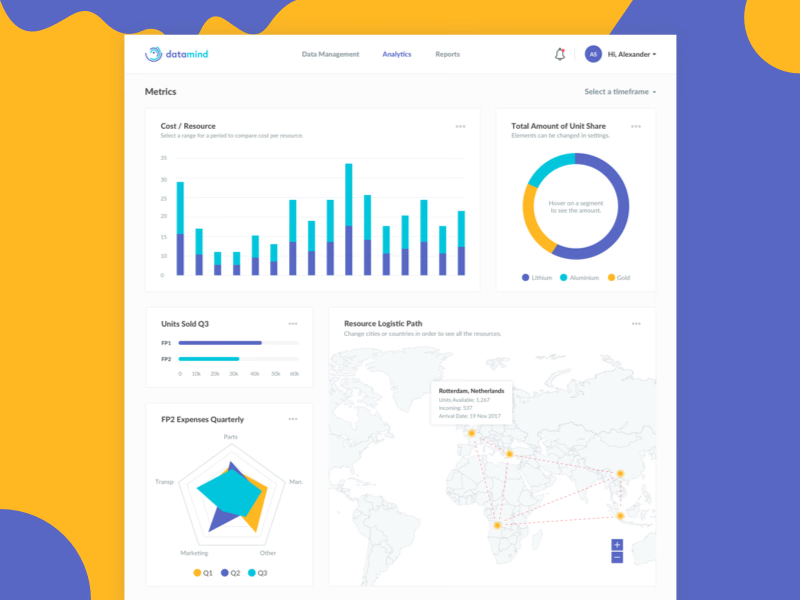
The analytics view in Datamind. After uploading a data set, users choose which data to track and in what amounts. In this example, a phone company follows its resources.
Cards split the metrics: cost per resource as stacked bars, unit share as a donut with a hover hint, units sold in Q3 as progress bars and quarterly expenses as a radar chart. The largest card maps the resource logistics path, and a tooltip on Rotterdam shows units available, incoming stock and the arrival date.
Each card has its own menu, and a timeframe selector sits at the top.
Got something real to build?
I join your team as a design partner and stay for the long run, from the first flow to shipped UI.