Report Builder 1/2 - Data Mind — Report builder chart type step for Datamind
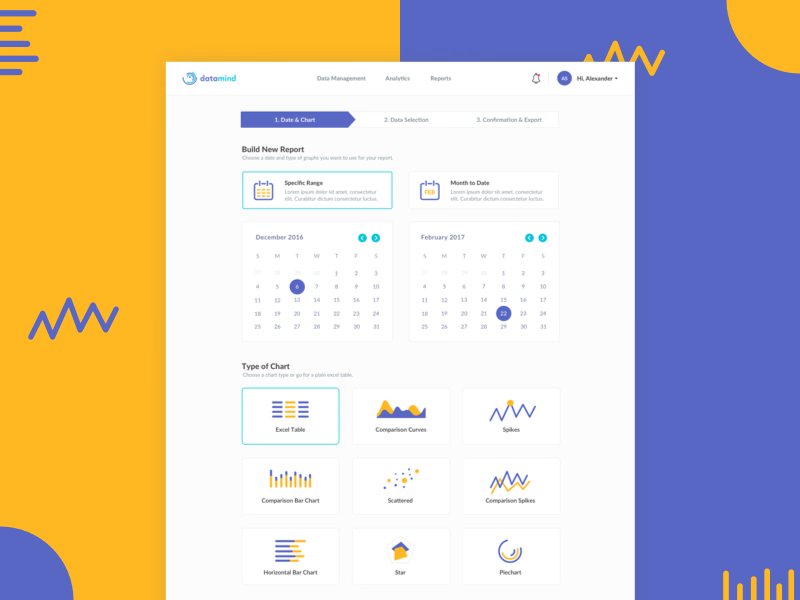
The first step of the report builder in Datamind, a data management tool for storing large data sets and turning them into custom reports.
Two choices happen here. First the dates: a specific range picked on two side-by-side calendars, or month to date. Then the type of chart: an Excel table, comparison curves, spikes, bar charts, a scatter, a star chart or a pie chart. Each type is a card with a small drawing of the chart, so people pick by what they’ll see rather than by name.
The next step narrows the data down.
Got something real to build?
I join your team as a design partner and stay for the long run, from the first flow to shipped UI.