Fitness Graphics — Fitness app stats graphics exploration
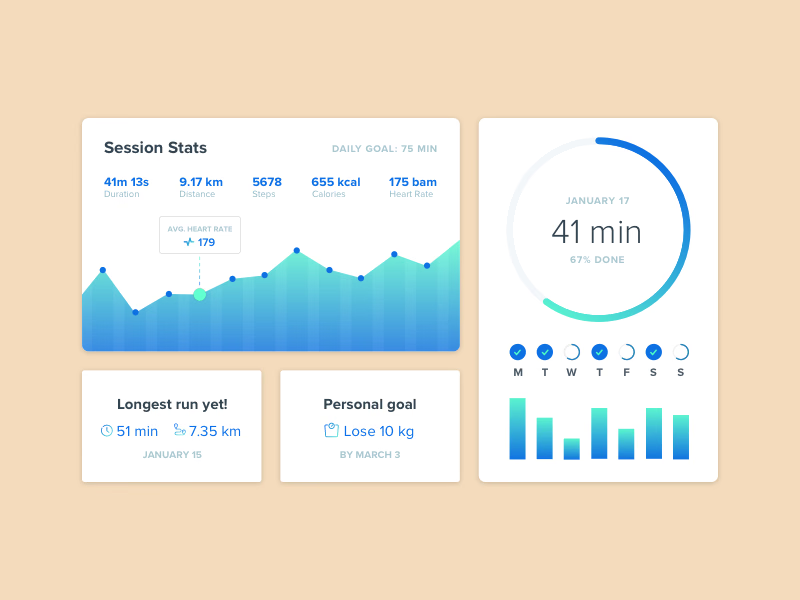
High-level graphics for a fitness app, made early in the project to show what the app does for people. It’s still an exploration, mostly about the look and the colors.
Session Stats lines up duration, distance, steps, calories and heart rate above an area chart, with the average heart rate flagged at one point. On the right, a ring shows progress toward the day’s goal, checkmarks track the week, and a bar chart shows the intensity of each workout. Two small cards celebrate the longest run and a personal goal. All the values are example data.
Got something real to build?
I join your team as a design partner and stay for the long run, from the first flow to shipped UI.