Conversion Dashboard — Early conversion analytics dashboard for Crobox
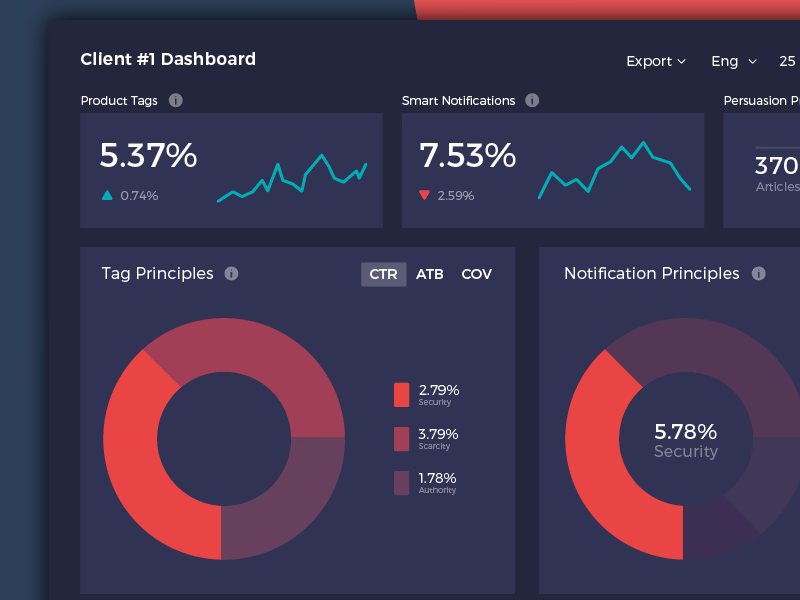
My first version of the Crobox dashboard, from when I was just starting out. Some elements are outdated, since the product’s structure changed a lot afterward.
Client #1 Dashboard opens with headline cards for product tags and smart notifications, each with a rate, its change and a sparkline. Below, donut charts break results down by persuasion principle, such as security, scarcity and authority, with a CTR, ATB and COV switch on the tag principles. The dark navy and red palette is where I played most with color.
Got something real to build?
I join your team as a design partner and stay for the long run, from the first flow to shipped UI.